Control Center
Your whole fleet,
live on the wall.
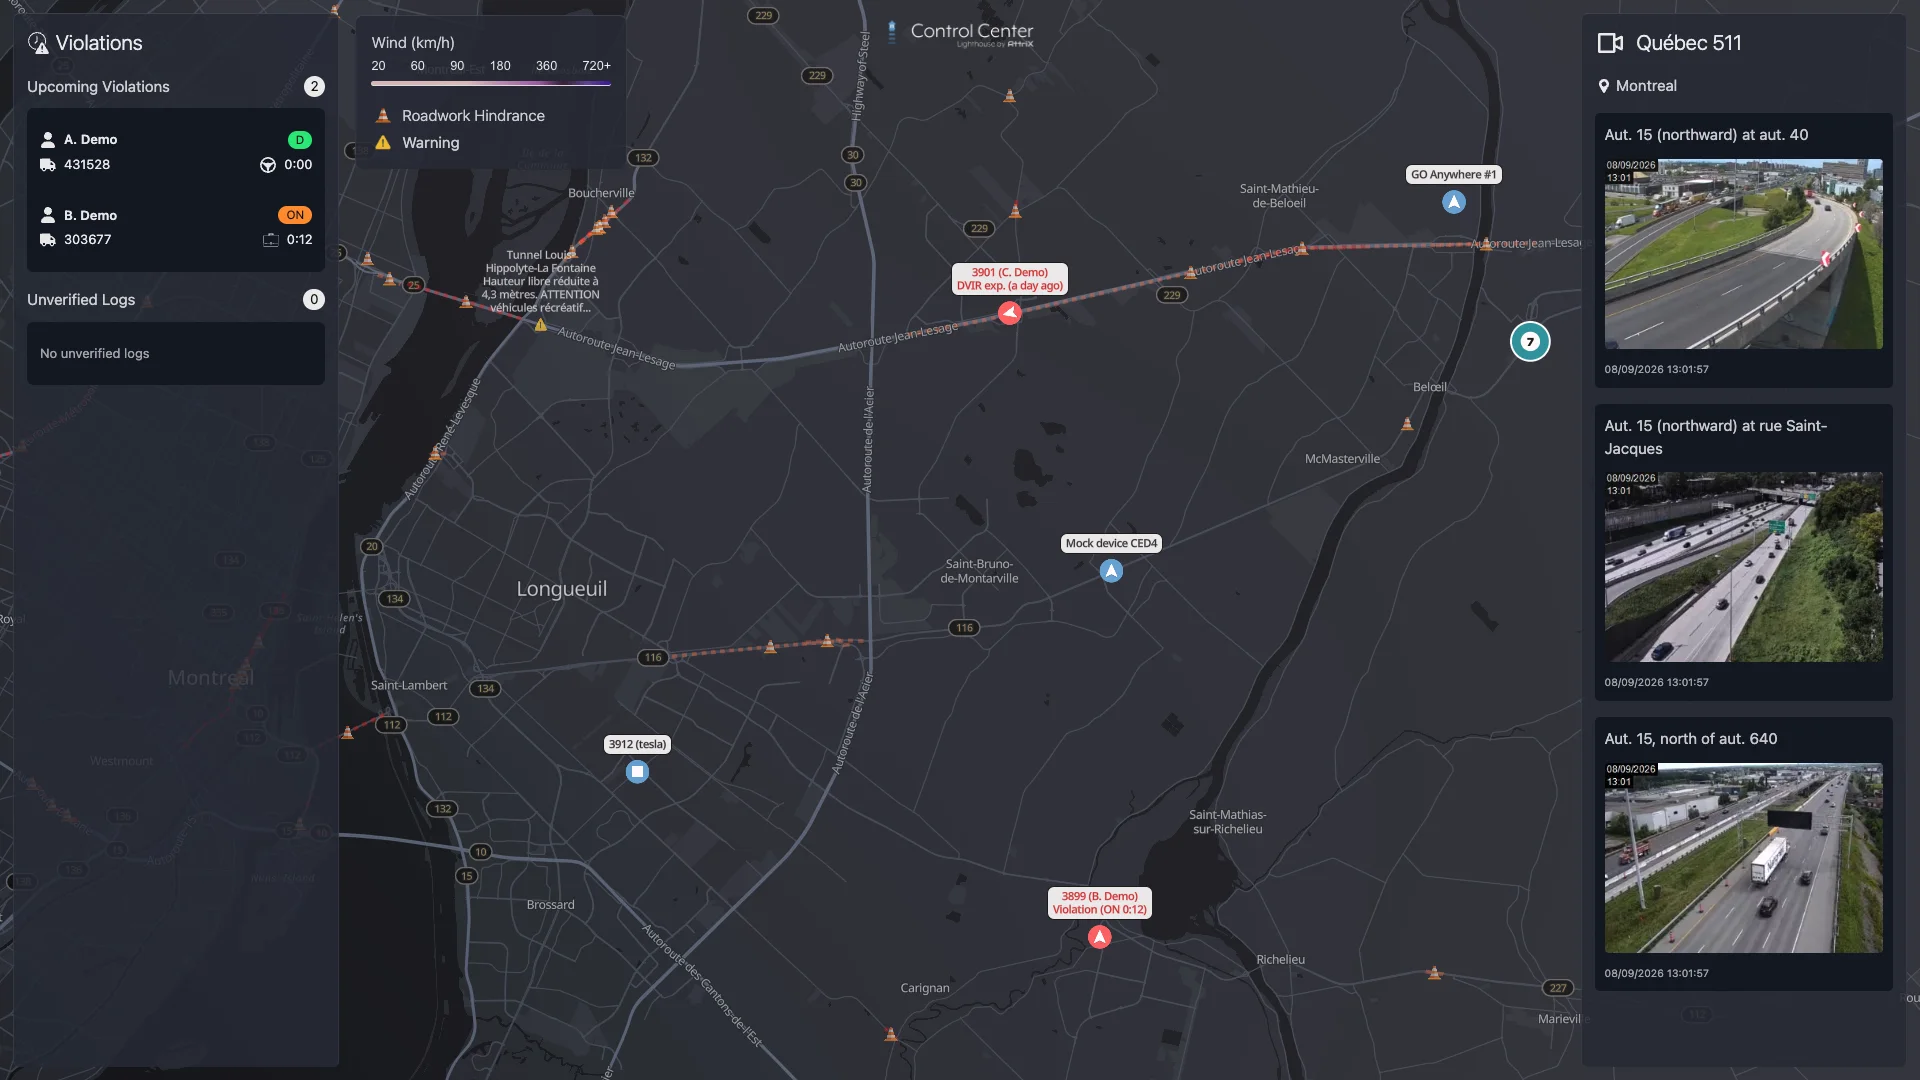
Control Center turns your Geotab data into a live operations wall for the dispatch room: the map, hours of service, inspections and defects, fleet KPIs, weather and traffic, on large screens the whole team can read.
One shared picture
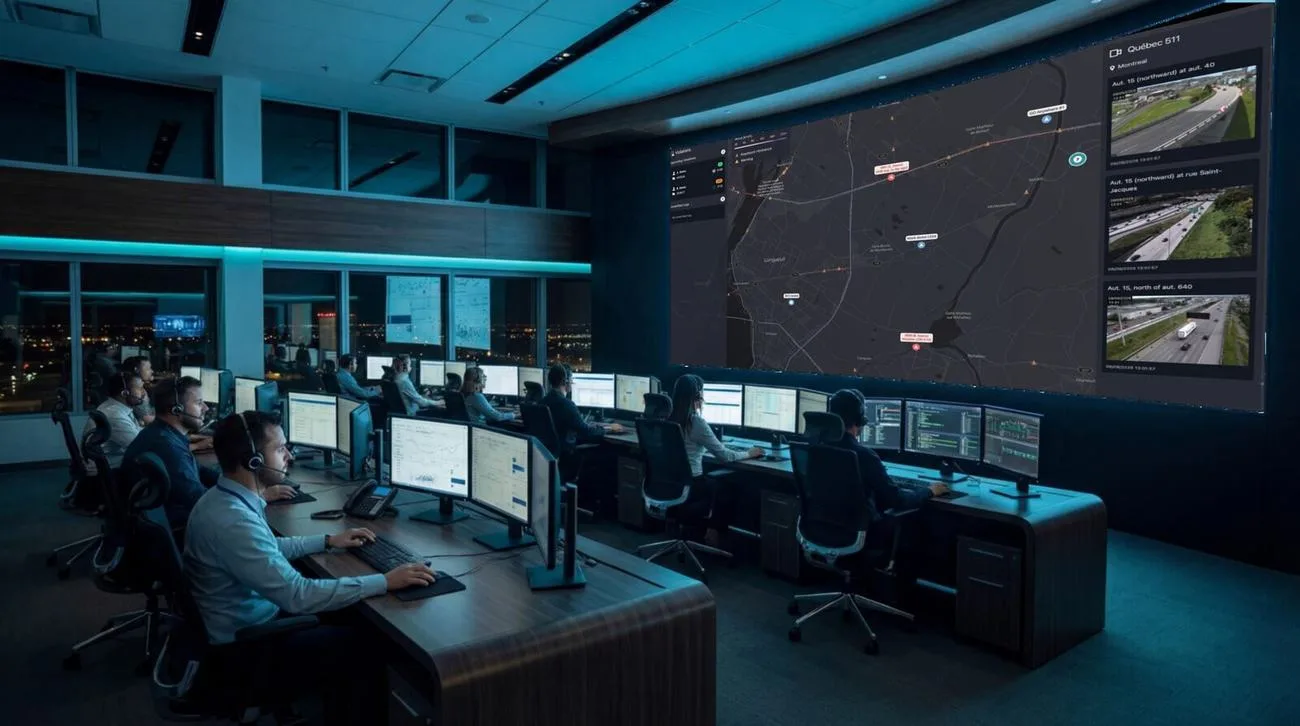
Operations happen on a shared screen.
Safety, dispatch and management decide together, but the data usually sits in one person's browser tabs. Control Center puts the same live picture in front of the whole room.
Fleet dashboards have no signage, signage tools have no fleet logic, and BI tools have no live operations feed. Control Center brings the three together, fed live by Geotab, with a layout for each department: safety, dispatch, maintenance, even the Driver Challenge standings.
What's on the wall
Everything dispatch needs, at a glance.
Live map
Every vehicle from your Geotab database, with violations, defects and alerts pinned where they happen, refreshed in under 30 seconds.
Hours of service
Upcoming violations, unverified logs and HOS trends, before they turn into tickets.
Inspections and defects
DVIR status, open defects and expiring safety rounds, plus DEF levels and EV charge.
Fleet KPIs
Distance, fuel used, fuel economy, fuel cost and cost per 100 km against last year, with idling and violation trends from Lighthouse.
Weather and traffic
Precipitation, snowfall and wind on the map, 511 roadwork and road warnings, and the traffic camera feeds you choose.
Industry news
Regulatory and industry news from the sources you pick, filtered by role, so updates reach the people they concern.
Safety and compliance
Act before the ticket.
- Violations, live. Hours-of-service and DVIR violations in front of the whole team, not in one inbox.
- Your safety record. Follow your carrier safety record and each driver's impact on it.
- Alerts on the map. An HOS alert, a defect or an expiring safety round shows up while dispatch can still act.
- On the move. Mobile Control Center brings HOS, defect and weather alerts to a phone or the in-cab terminal. Nothing to install.
Winter operations
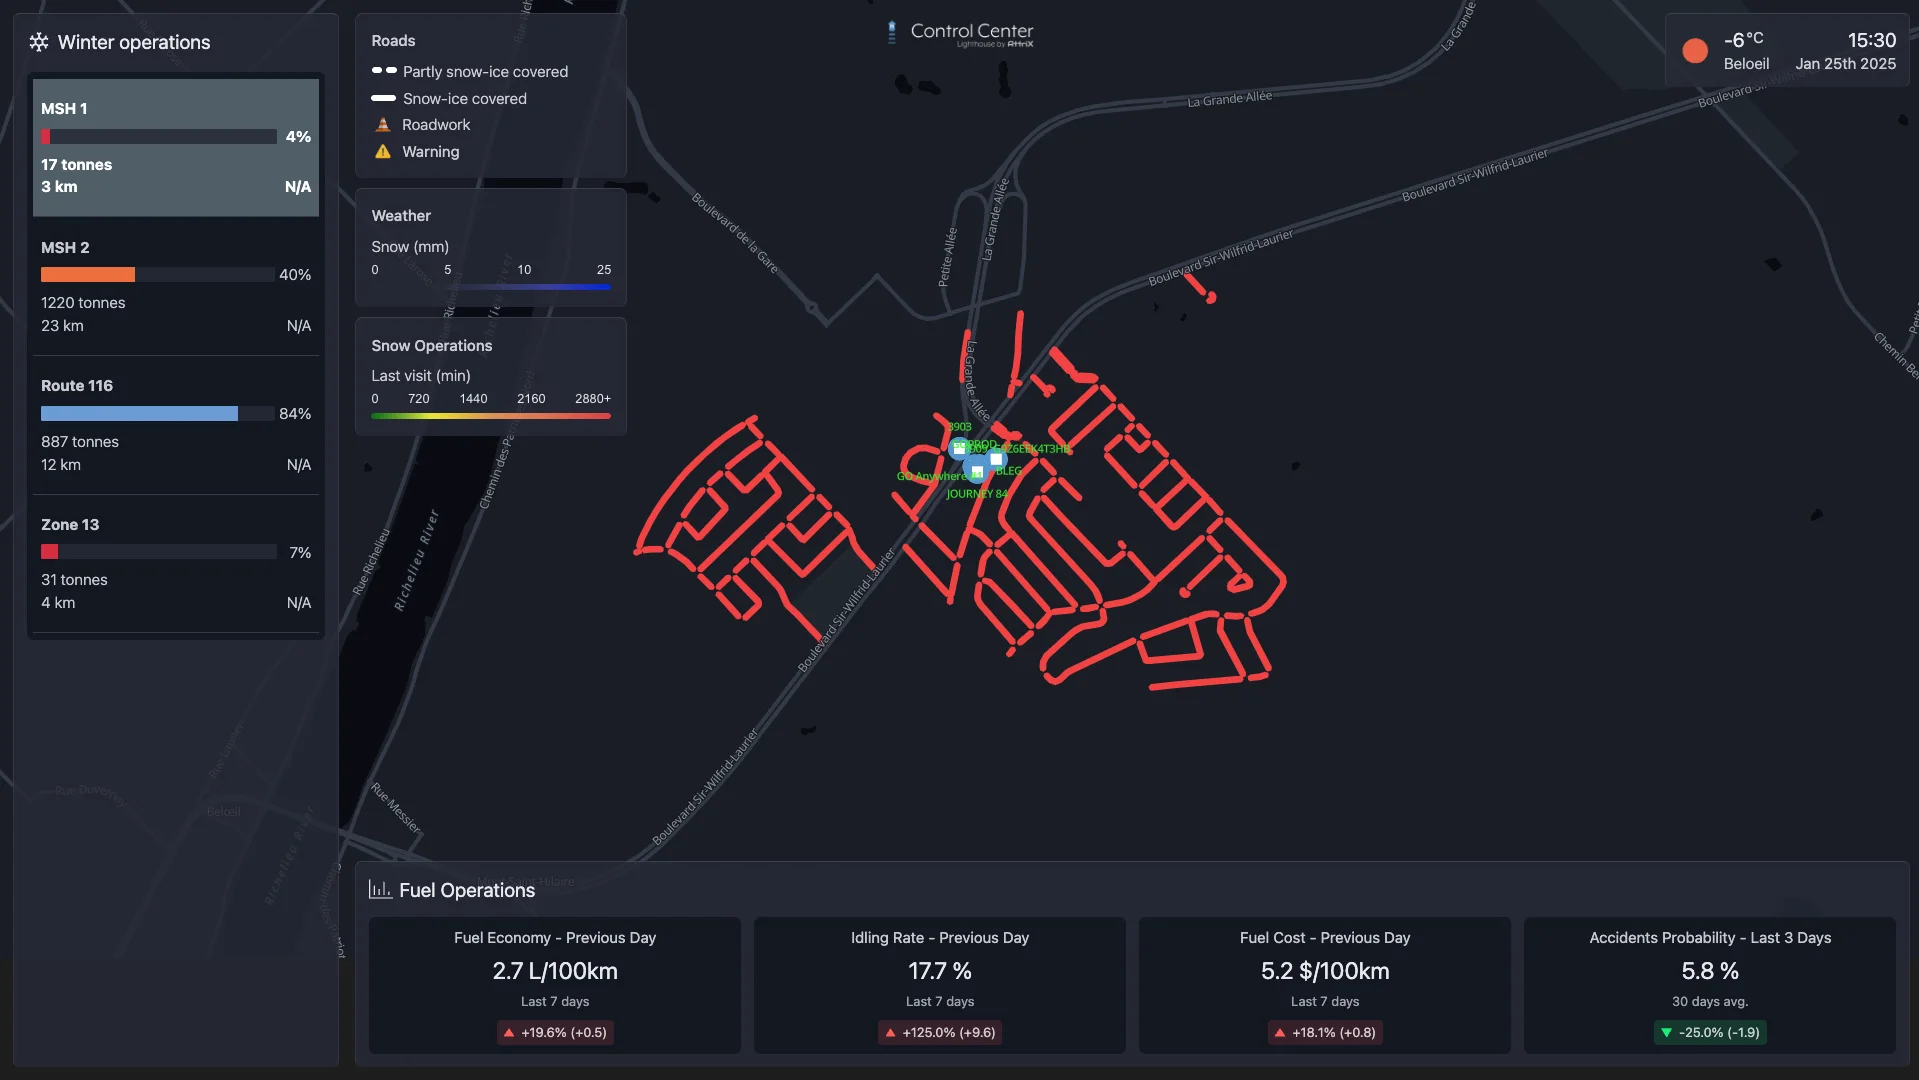
Every snow route, street by street.
- Routes at a glance. Completion, salt spread and distance for each snow route and zone.
- Last visit on every street. Colour shows how long since a truck went by, from just now to two days and more.
- Road conditions. Snow- and ice-covered roads, roadwork and warnings, with snowfall on the map.
- Yesterday's operations. Fuel economy, idling rate, fuel cost per 100 km and accident probability.
Managed for you
Screens on the wall, nothing to babysit.
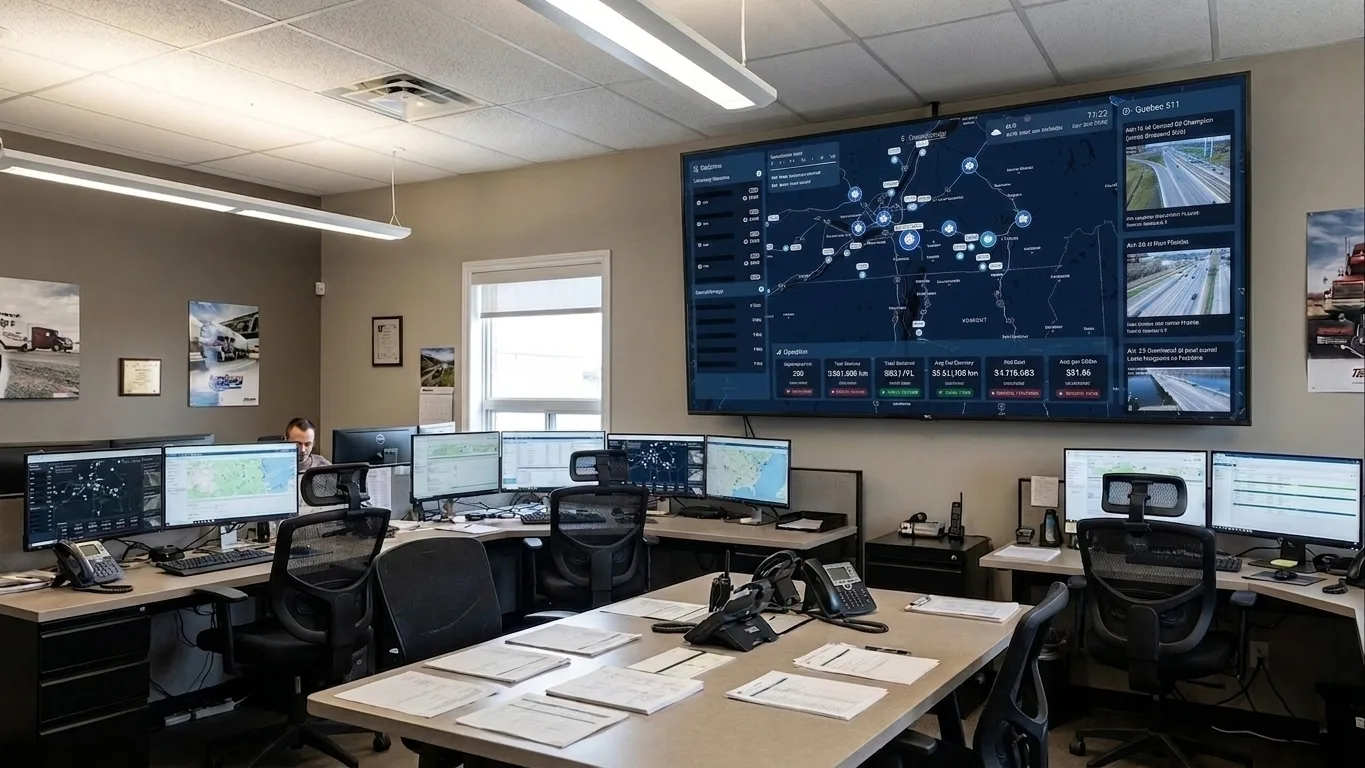
- Commercial displays. Samsung Smart Signage from 32 to 85 inches, rated for 24/7 use, with a 3-year warranty.
- Managed remotely. A managed display licence: we keep the screens running and up to date.
- Integrated with Geotab. It reads your Geotab data directly and refreshes in under 30 seconds, even at 1,000+ vehicles, with fleet KPIs from Lighthouse.
- Your content, from MyGeotab. Manage what each screen shows right from MyGeotab with the integrated CMS. Start from a standard template, or have a custom layout and data model built for your operation.
See Control Center on your own fleet.
Book a demo built around your hours-of-service, inspection and safety-record workflow. We'll show you what's live today and help you choose the screens and the setup.